Overview
As the co-founder and Head of Design at Reverbant, I established and developed working relationships with many customers. As part of a client engagement, I led a design team that executed a dashboard solution for an energy consulting company.
I drove deep integration of the software and data capture experience, including navigating a highly complex architecture for data routing. We established an iterative discovery and design approach via core user flows with known and unknown actors. I was also responsible for establishing the initial design system that could be expanded for additional dashboard views, reporting, and other product offerings from EFM.
Opportunity
EFM, an energy consultancy focused on conservation, needed a more comprehensive view of its customers' overall energy profile to understand energy usage at facilities. Prior to meeting with our group, much of the reporting around energy usage at EFM customer sites was incomplete and difficult to acquire. Usage reports had to be compiled manually in spreadsheets and emailed to EFM headquarters. With each new customer EFM acquired, lack of standardized reporting processes and energy data gathering made customer interactions confusing. Without a centralized and comprehensive reporting capability, it hindered EFM's ability to productively address energy inefficiencies and recommend improvements at facilities.
Process
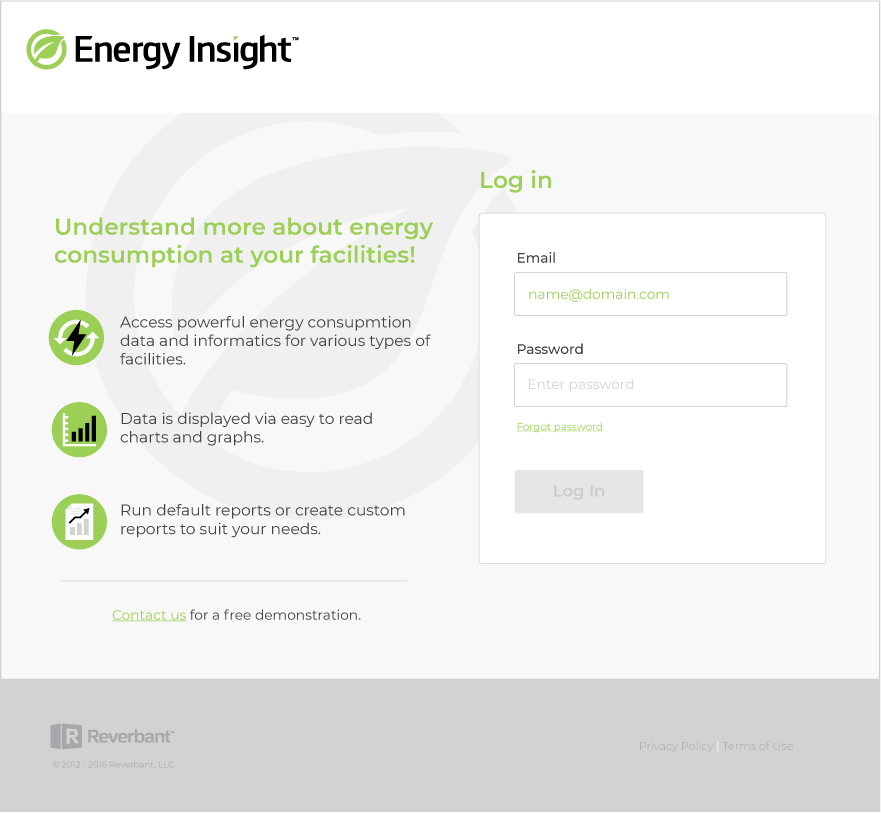
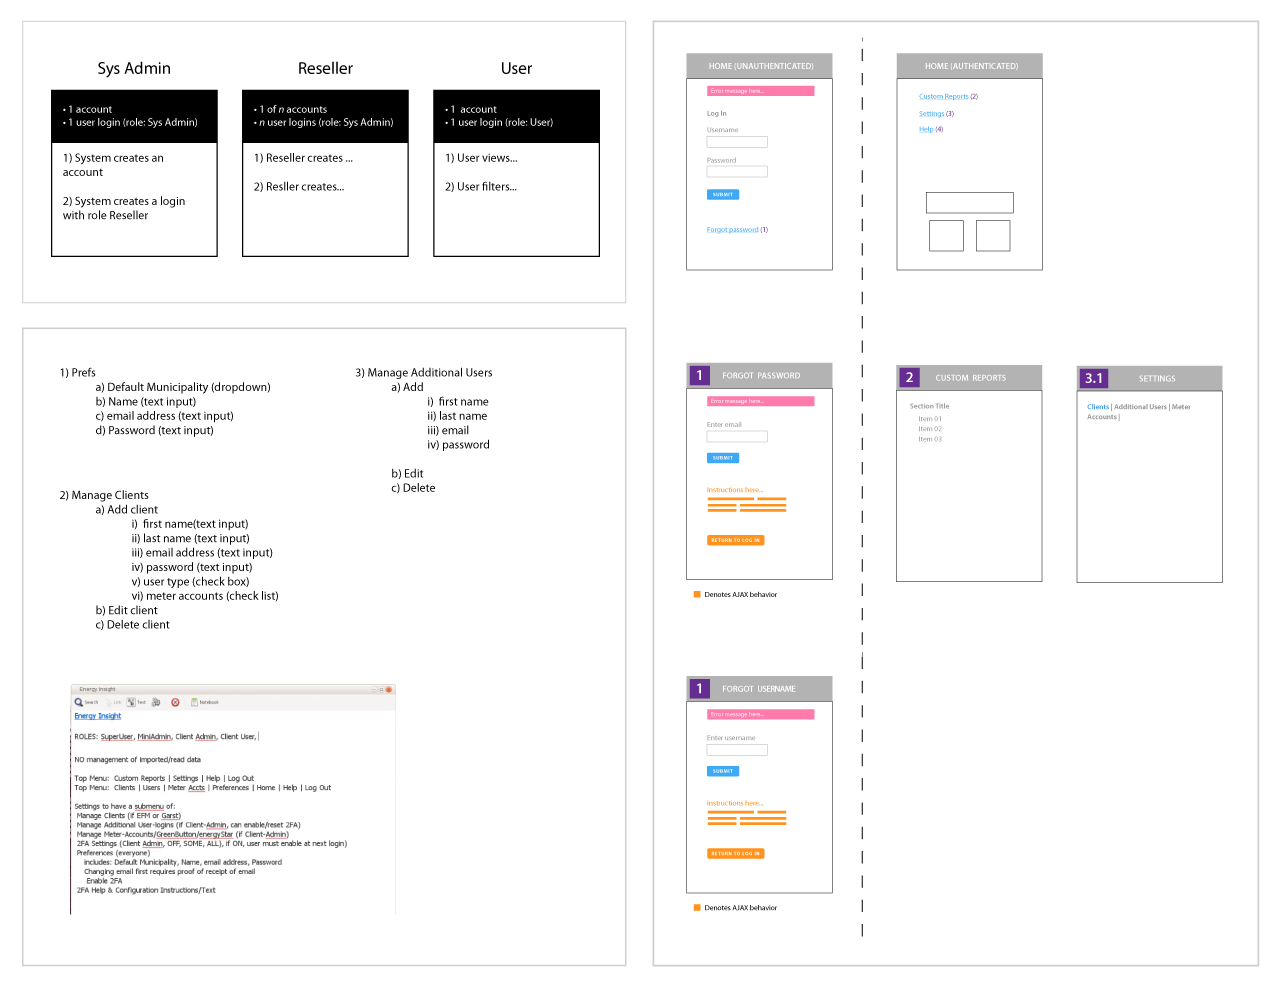
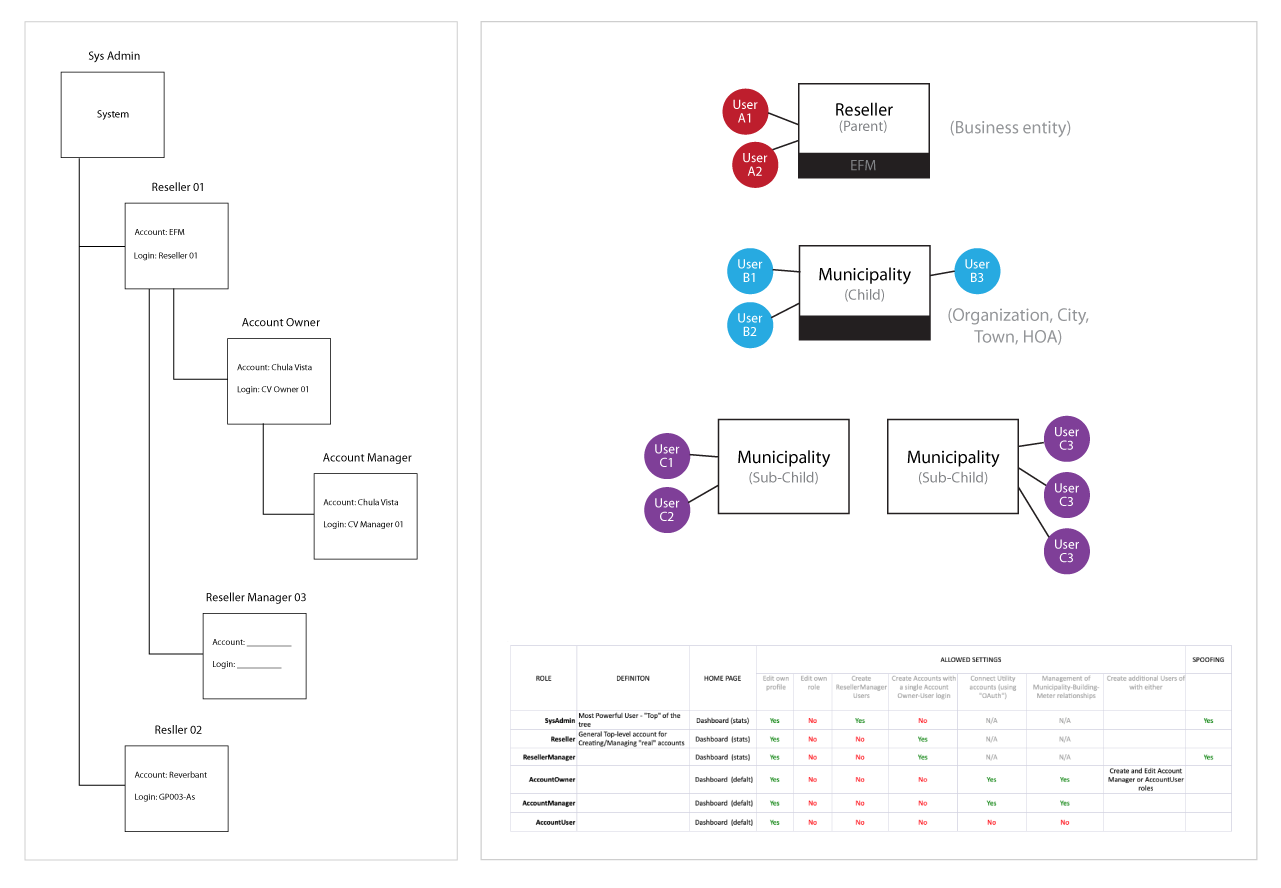
We began by developing an understanding of the actors involved, the role each played, and the scope of control each had. We met with representatives from EFM to discuss requirements and discover more about their customers. We documented characteristics of customer profiles and the various local, state, and federal energy agencies each customer interacted with. I implemented an audit of the EFM customer base and performed internal interviews to get a better understanding of both shared and unique objectives related to a cross section of users. Design iterations via rapid prototypes steered us in the direction of a dashboard model, to monitor customer energy consumption and optimization, with variations presented and reviewed with EFM stakeholders.
Findings
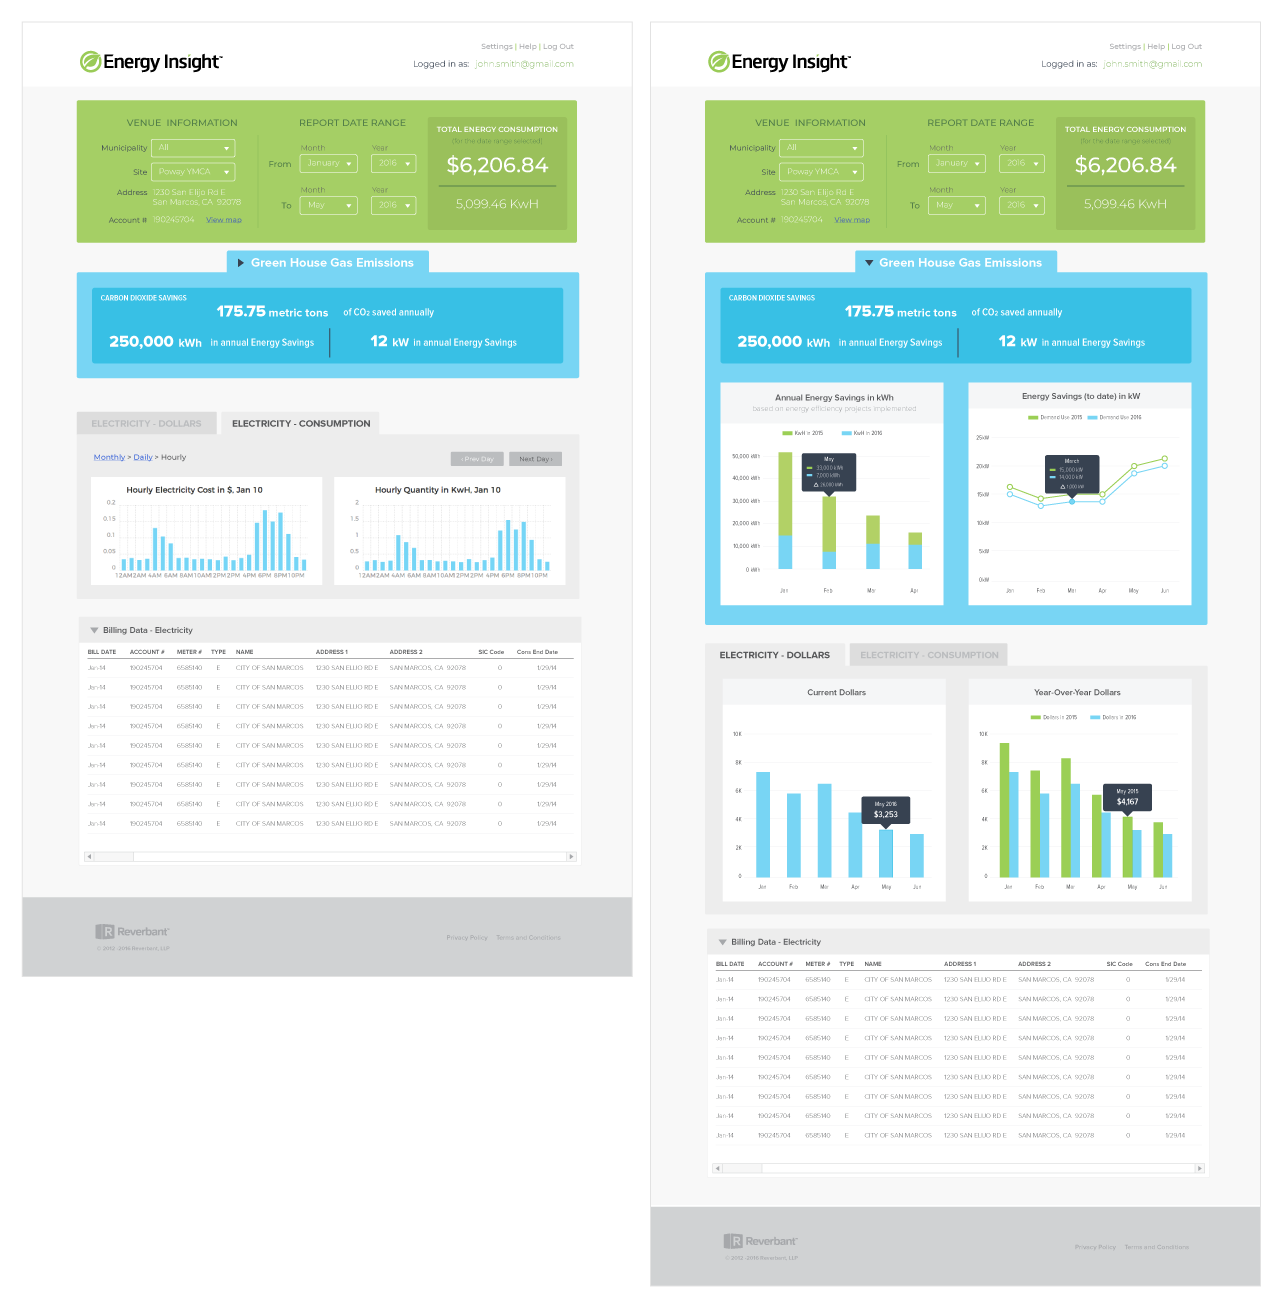
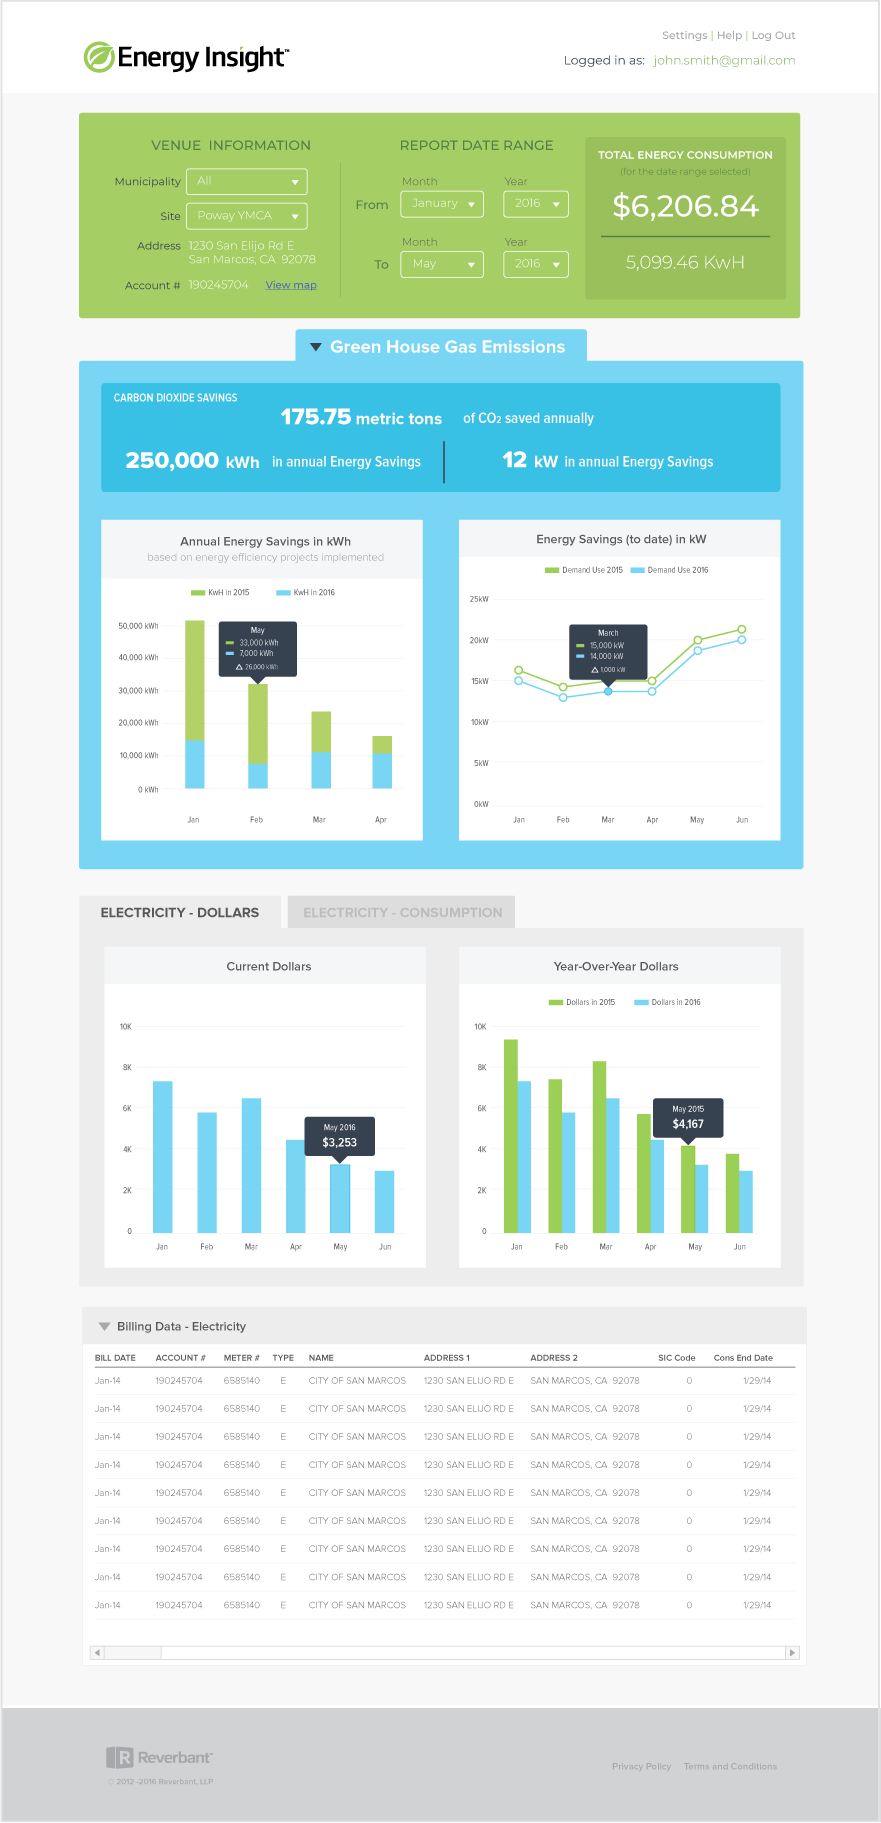
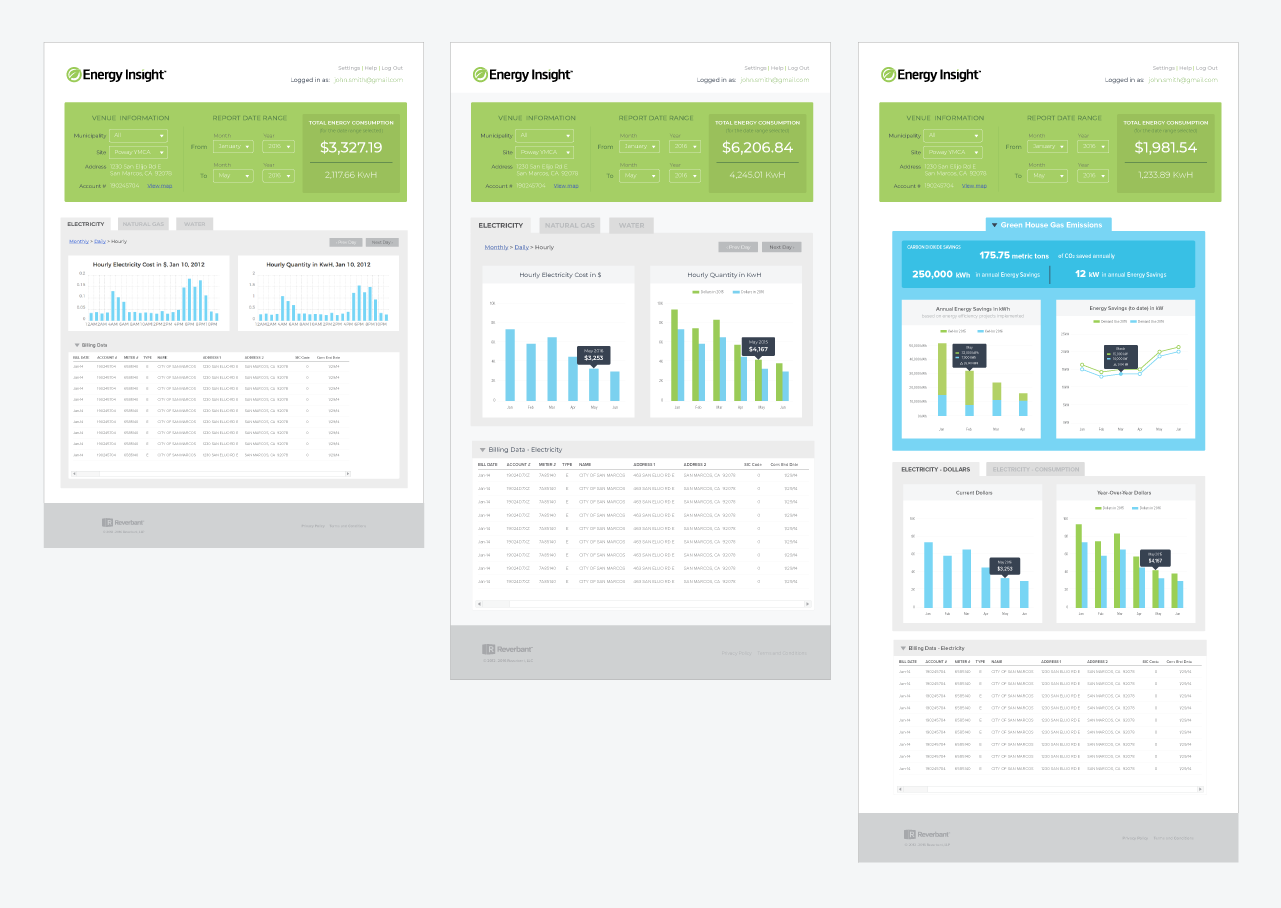
Now armed with this information, I directed the team to refine the dashboard design with a focus on information hierarchy with an emphasis on prioritization of how users would look to consume the data and traverse the page. With continuous feedback, I discovered ways we could improve the prior design. Working with the Lead Development Engineer we had to address a major challenge regarding the lack of a service to plug into the standard energy API. After many attempts and several trial-and-error efforts we finally were able to develop a custom service to solve this issue. We observed users interacting with the data, specifically the graph information it's contextual tooltips. The final design set the framework for necessary customization of comprehensive and relevant information presented in a hierarchical manner.
Results
The dashboard solution was well received. The feedback was positive and both the energy consultancy and its customers indicated that the solution surpassed their needs. The application solved a major pain point by allowing a comprehensive all-in-one dashboard view of aggregated energy usage at a given facility. This enabled the energy consultancy to address energy inefficiencies and recommend improvements at customer facilities.
- Reporting indicated an average of 14% reduction in overall energy expenses in first month following initial energy audit improvements
- Electric, gas and water data consumption now aggregated in a single view
- Data frequency interval now available for day, week and month
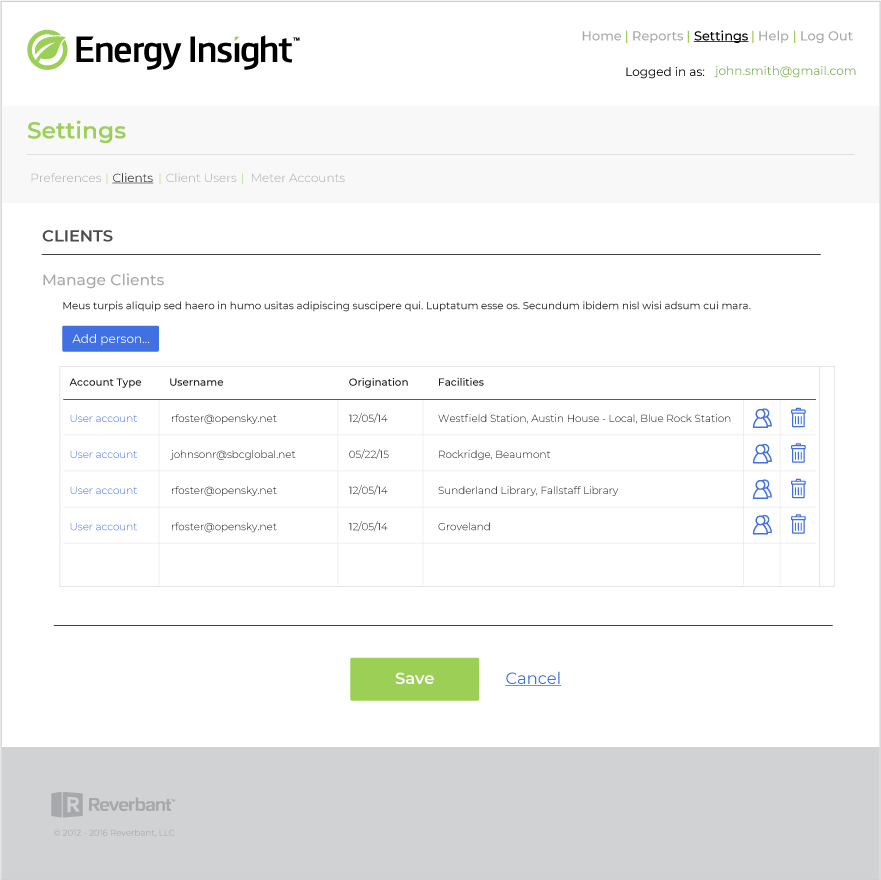
- Support for multiple facilities for a single client, removing the need for individual accounts for each facility
- Improved report generation and archiving
- Created custom service to plug into standard energy API
